Original Article - Volume 2 - Issue 5
Red cell distribution width as a proxy marker of hemoglobinopathies among an eastern Sudan patient population
Mohamed Omer Gibreel; Bashir Abdrhman Bashir*
Hematology Department, Faculty of Medical Laboratory Sciences, Port Sudan Ahlia College, Port Sudan, Sudan.
Received Date : Aug 11, 2022
Accepted Date : Sep 14, 2022
Published Date: Sep 19, 2022
Copyright:© Mohammed Bashir 2022
*Corresponding Author : Bashir Abdrhman Bashir, Hematology Department, Faculty of Medical Laboratory Sciences, Port Sudan Ahlia College,Port Sudan, Sudan.
Email:bashirbashir17@hotmail.com
DOI: Doi.org/10.55920/2771-019X/1247
Abstract
Background: Haemoglobinopathies are genetic hemoglobin morbidities marked by erythrocyte anisocytosis. Anisocytosis is measured by red cell distribution width (RDW), which is easily provided by hematology analyzers as a total blood count statement. In Sudan, the efficacy of RDW as a prognostic biomarker for hemoglobinopathies is limited and unsubstantiated.
Objective: The purpose of this study was to illustrate the diagnostic efficiency of RDW in the diagnosis of hemoglobinopathy in eastern Sudanese patients.
Material and Methods: A case-control hospital-based study was held from January 2013 to December 2015. In this study, 59 patients and 59 controls were recruited. Capillary electrophoresis was used to confirm the findings. Red cell distribution width for hemoglobin variants was explored using the receiver operating characteristic (ROC) curve.
Results: The RDW exhibited a diagnostic marker in Sickle cell disease (SCD) phenotypes at 14.2% ROC curve (AUC= 0.792; P= 0.015; sensitivity = 85.1; specificity = 82.0; 95.2% CI: 0.597-0.987). Red cell distribution widths were also successful in detecting -thalassemia trait, according to a 15.6 % ROC curve (AUC= 0.708; P= 0.038; sensitivity = 79.0 %; specificity = 77.0 %, 95 % Confidence interval 0.597-0.987).
Conclusion: These findings imply that the red cell distribution width is a promising diagnostic marker for sickle cell disease and β-thalassemia traits. Nonetheless, as the data used were retrospective, more research should be done to establish the diagnostic significance of this hematological index for hemoglobinopathy.
Keywords: Red Cell distribution width; Proxy marker; hemoglobinopathies; eastern Sudan.
Introduction
Hemoglobinopathies are genetic hemoglobin problems generated by mutations in the genes that codify the polypeptide chain of hemoglobin. These structural hemoglobin defects provide functionally compromised molecules, which induce poor oxygen supply and vulnerability to elimination by the victim’s reticuloendothelial system, with lethal or life-threatening severe anemia and hypoxia as a result [1]. According to the World Health Organization, over 7% of the world’s population has an inherited hemoglobin problem gene, and about 300,000 infants are delivered with severe hemoglobin impairments each year, with over 200, 000 in Sub-Saharan African countries [2]. Hemoglobinopathies are ignored but emerging worldwide health issues; children in Sub-Saharan Africa with hemoglobin variants have an anticipated mortality rate of 50 % to 80% by the age of 5 years [3,4]. Laboratory testing is the most reliable technique to diagnose blood abnormalities; but, due to the lack of efficient programs for early diagnosis and treatment, most affected infants in African countries continue to die during infancy, commonly without being diagnosed [5]. Red cell distribution width has previously been shown to be a useful diagnostic issue for distinguishing iron deficiency anemia from other microcytic anemia, as well as thalassemia. RDW, a hematological measure or parameter, appears to be able to distinguish hemoglobinopathies from other anemiarelated erythrocyte diseases [6]. Within the red cell population, the RDW detects variation in red blood cell sizes (anisocytosis) and shapes (poikilocytosis) in cell volume. These are phenotypic characteristics of erythrocytes that are frequently aberrant in the presence of hemoglobinopathy [7]. The RDW is a simple, faster, cheaper, and commonly utilized test in everyday practice as part of a comprehensive hemogram report since it is one of the hematological indices routinely generated by automated hematology analyzers in clinical laboratory assays. The RDW has been investigated as a key player in several diseases affecting erythrocyte size and shape changes. It is calculated and shown as a coefficient of variation or standard deviation [7,8]. The RDW has been demonstrated to be potential as a marker for laboratory detection of hemoglobinopathies; yet, there is little information on its application in Sudan. The principal goal of this research was to determine the RDW’s overall performance as a proxy marker of hemoglobinopathies in age-mixed patients.
Materials and Methods
Study design
A case-control comparative hospital-based study of 59 randomly chosen, capillary electrophoresis verified hemoglobinopathy patients and 59 (controls) subjects without hemoglobinopathy, has been operated from January 2013 to December 2015 at Port Sudan Teaching Hospital in Red Sea State, Sudan.
Data collection
Findings were extracted from patients checked at the hospital’s hematology laboratory between January 2013 and December 2015. The Sysmex analyzer was used to provide completeblood count results (KX-21N, Sysmex Corporations, Japan). Participants were confirmed for various hemoglobinopathies using Capillary electrophoresis technology. Individuals in the control group were thought to be free of problems related to aberrant erythrocyte shape and size (such as hemolytic, macrocytic, or iron deficiency anemia) and hemoglobinopathy. These were age-mixed people with normal hemoglobin (hemoglobin AA genotype) and hemoglobin values of ≥ 10 g/dl electrophoretically verified. RDW values were obtained from a semi-automated hematology analyzer for all participants as a part of their full blood counts.
Data analysis
The data were analyzed using the Statistical Package for Social Sciences version 25 (SPSS Inc., Chicago, USA). The RDW diversity within hemoglobinopathy variants was studied using the Kruskal-Wallis H-test, whereas the RDW’s variations between groups were compared using the Mann-Whitney U-test, as recommended by Nahm, 2016 [9]. As a result, the control group’s normal RDW reference values were used as the upper limit of the median’s 95 % confidence interval (CI). The RDW was represented as a mean± standard deviation, and the existence of hemoglobinopathy was expressed as a percentage or femtoliter. The RDW’s diagnostic efficacy in distinguishing diseased (hemoglobinopathy) from non-diseased (hemoglobinopathyfree) populations was investigated using receiveroperating characteristic (ROC) curves analysis.
Ethical approval
The study was conducted under the ethical principles that have their origin in the Declaration of Helsinki. It was carried out with patients’ verbal and analytical approval before the sample was taken. The study protocol and the subject information and consent form were reviewed and approved by a local ethics committee of Red Sea State, the Ministry of Health, and the Sudan University of Science and Technology according to the document number (RS/MS/23-X 5/1/2013) to get this approval.
Results
Participants’ details in the study
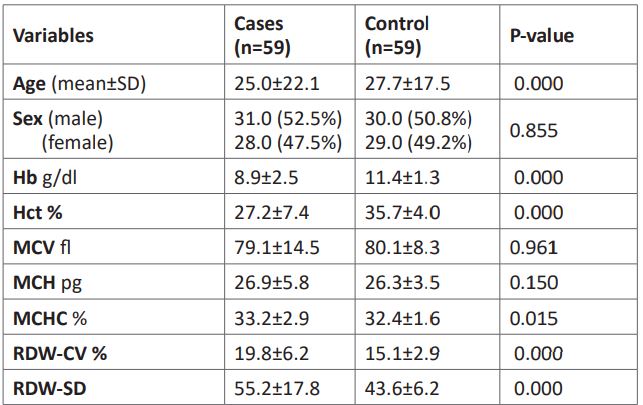
The participants in this study were 118 citizens of the Red Sea state. There were 59 patients overall, 31 (52.5%) males and 28 (47.5%) females, had mean ages of 24.5±25.2 years and
25.7±18.7 years, respectively, for males and females. The 59 control participants included 30 (50.8%) males and 29 (49.2%) females, with the average ages of the female and male subjects being 27.2±20 and 28.1±15.0 years, respectively. The fundamental parameters that focused on hematological data are summarized in (Table 1).
Table 1: Fundamental differences between controls and cases of hemoglobinopathies.
Leveraging RDW to phenotype hemoglobinopathies
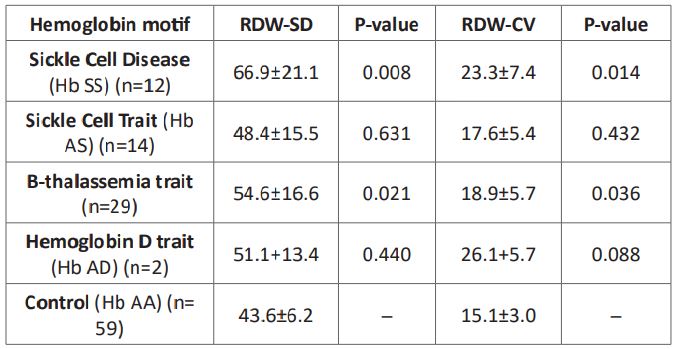
The sickle cell disease (hemoglobin SS) phenotype’s RDW-SD and RDW-CV means were 66.9±21.1 and 23.3±7.4, respectively, which were substantially higher than those of the control group (43.6±6.2 and 15.1±3.0, respectively). In comparison to the control group, those with pure hemoglobin AS genotype had dramatically higher, RDW-SD and RDW-CV mean of 48.4±15.5 and 17.6±5.4, respectively. In addition, RDWSD and RDW-CV mean values were vastly higher in patients with β-thalassemia traits versus the control group (43.6±6.2 and 15.1±3.0, respectively). These values were 54.6±16.6 and 18.9±5.7, respectively. Also, the hemoglobin AD genotypes were considerably higher than the control groups, which were 51.1+13.4 and 26.1+5.7, respectively. When compared to the control, the patient with hemoglobin AE genotype showed no statistical difference (Table 2).
Table 2: ROC Red cell distribution widths in hemoglobinopathies.
Red cell distribution ROC curve in SCD and SCT phenotyping
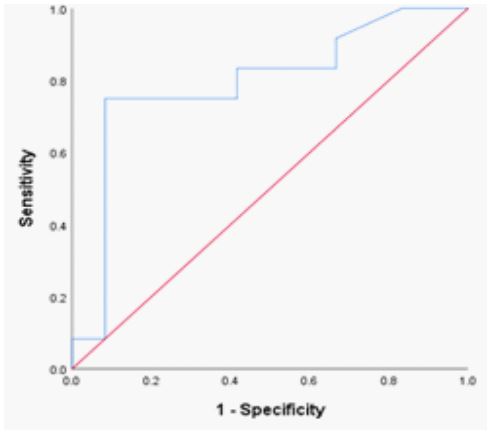
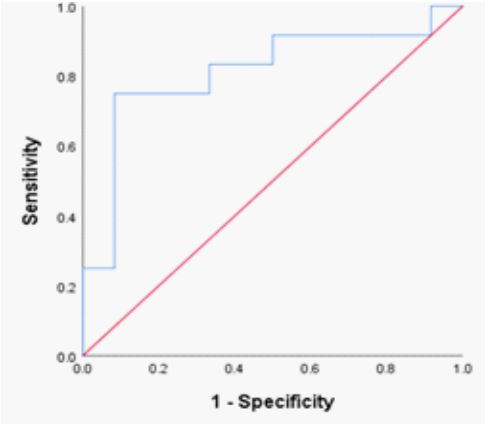
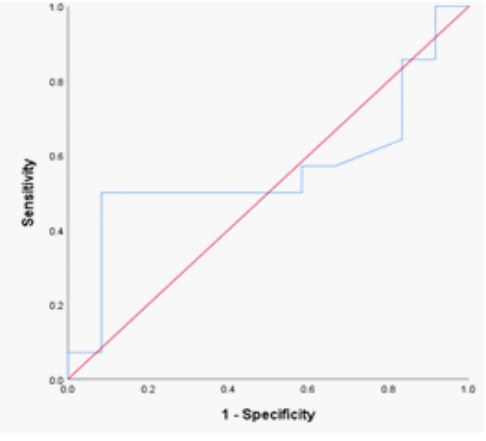
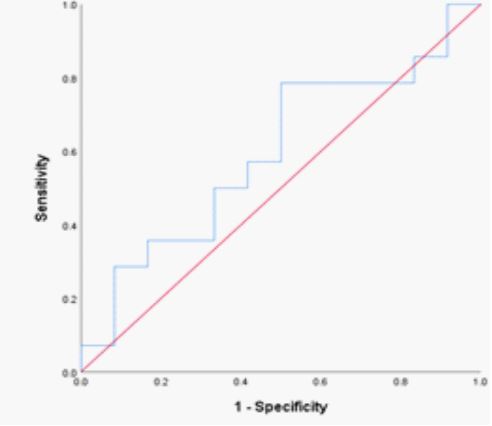
The hemoglobin SS genotype’s RDW-CV fraction was 14.2% (n = 12; AUC= 0.792; P= 0.015; sensitivity = 85.1 %; specificity = 82.0 %; 95% CI 0.597 – 0.987). (Table 2; Figure 1) shifting the curve to the ROC curve’s left upper side. The hemoglobin SS genotype was present in 42.1 fl of the RDW-SD samples (n = 12; AUC= 0.813; P= 0.009; sensitivity = 86.0 %; specificity = 83.0 %; 95% CI 0.627 – 0.988); (Table 2; Figure 2) causing the curve to migrate to the ROC curve’s left upper side. For the diagnosis of the sickle cell trait (SCT) phenotype, the RDWCV proportion for the hemoglobin AS genotype was 14.2% (n = 14; ROC curve flowed along the diagonal line = 0.560; P= 0.607; sensitivity 57%, specificity, 59 %; 95% CI 0.325 – 0.794)
(Table 2; Figure 3). The ideal RDW-SD ROC curve coordinates at 41.5 fl also did not have diagnostic significance (P= 0.411, sensitivity 57%, specificity, 59 %; 95% CI 0.372 – 819) (Table 2; Figure 4).
Figure 1: ROC Red cell distribution widths in hemoglobinopathies.
Figure 2: ROC curve of RDW-SD in SCD phenotypes.
Figure 3: ROC curve of RDW-CV in SCT phenotypes.
Figure 4: ROC curve of RDW-SD in SCT phenotypes.
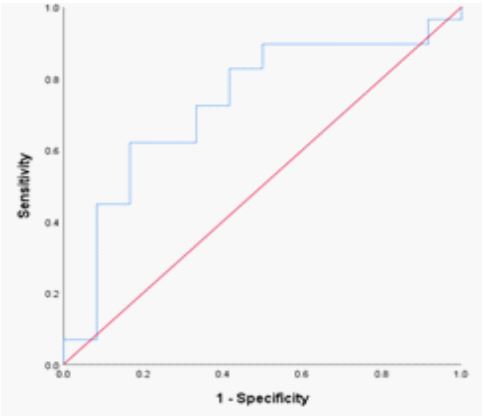
Figure 5: ROC curve of RDW-CV in β-thalassemia trait.
Figure 6: ROC curve of RDW-SD in β-thalassemia trait.
ROC curve in β-thalassemia
For β-thalassemia trait, the RDW-CV optimum point of 15.6% was significant (P = 0.038). The ROC curve matched the diagonal line; the area under the curve was 0.708; the sensitivity and specificity values were 79% and 77%, respectively, 95% CI 0.532 – 0.884 (Table 2; Figure 5). The RDW-SD optimum point of 42.5 fl for -β-thalassemia was significant (P = 0.022). The ROC curve flowed the diagonal line, with an area under the curve of 0.730, a sensitivity of 75%, a specificity of 73%, and a 95% CI of 0.556 – 904. (Table 2; Figure 6).
Discussion
RDW may be employed as a proxy biomarker for extreme morbidity and/or fatality brought on by a variety of cancers, notably carcinoma [10], myeloma [11,12], and even hematological neoplasms [13 – 16]. RDW has additionally been reported to be a valuable diagnostic and prognostic marker for pre-eclampsia [17], a novel predictive biomarker for cardiovascular disorders [18,19], advancement to end-stage renal disease among diabetic patients, and other pathologies [20]. Collectively, these studies explore how RDW is increasingly useful for diagnosingor predicting a variety of noncommunicable diseases.
This is the first such attempt to ascertain whether the RDW value may be used to predict various hemoglobinopathies in eastern Sudan. Sickle Cell Disease phenotypes might be substantially predicted by the RDW-CV and RDW-SD, however, SCT phenotypes could not be. The RDW’s overall accuracy made it a remarkable biomarker for SCD hemoglobinopathies [21].
RDW’S were also capable of predicting hemoglobin D trait and β-thalassemia trait. Therefore, using this possible biomarker as a cost-effective strategy is an option for nations with limited financial resources that have not yet introduced neonatal and population screening facilities [22]
The RDW-CV demonstrated significant (P 0.015) biomarker characteristics in homozygous SCD with a sensitivity of 85.1 %, specificity of 82 %, and accuracy of 0.792. Mutua et al [22] reported similar findings of higher RDW, with homozygous SCD getting the highest RDW. It follows that in a population, an RDW > 14.2% can detect 85.1% of people as having SCD, while an RDW of 14.2% can detect 83% of people who would test negative for SCD. According to this, at 14.2%, the RDW can be effectively employed as a diagnostic biomarker for SCD characteristics in eastern Sudan.
The ROC curve highlighted that the RDW was a superior diagnostic marker for identifying β-thalassemia with a 15.6 % detection rate and an accuracy of 0.708 (P 0.038). It is feasible to use the RDW to discern β-thalassemia from the healthy population because the β-thalassemia ROC curve flowed along the diagonal line with minimal diagnostic significance, similar to Roth et al [23] report that β-thalassemia had a normal or
mildly elevated RDW at a mean of 14.6. Mutua et al also had a consistent outcome [22].
The SCT phenotypes were not distinguished from the healthy populations by the RDW ROC curves. Similarly, Mutua et al reported that SCT has (accuracy: 0.501; P = 0.976) RDW at a mean of 15.1 %, and the SCT ROC curve flowed along the diagonal line associated with a poor diagnostic significance of 14.2 % (Accuracy: 0.560; p = 0.607), this means it is not conceivable to use the RDW to distinct SCT from the healthy individuals.
Limitations
The tiny sample size prevented statistical significance for Hemoglobin E, D, and B-thalassemia majors despite their significantly elevated RDW readings.
Conclusion
These outcomes suggest that the RDW is a promising diagnostic marker for β-thalassemia trait and SCD characteristics. The diagnostic value of this hematological index for hemoglobinopathy should, however, be further investigated using prospective data because the data utilized were retrospective. In low-resource settings, it will be permissible to provide and use powered mini-electrophoretic equipment because a confirmatory test would still be necessary.
Acknowledgment
We wish to express our deepest thanks to all patients with hemoglobinopathies participating in this study for their kind acceptance to be enrolled in this academic work.
Financial support and sponsorship: Nill.
Conflicts of interest: There are no conflicts of interest.
References
- Weatherall D. The inherited disorders of haemoglobin: An increasingly neglected global health burden. Indian J Med Res.2011; 134(4): 493.
- Piety NZ, Yang X, Kanter J, Vignes SM, George A, Shevkoplyas SS. Validation of a low-cost paper-based screening test for sickle cell anemia. PLoS One. 2016; 11(1): e0144901.
- Sawaimul KD, Iqbal MB, Sawaimul VD, Kambale T, Hanmante R. Study to identify the role of high-performance liquid chromatography in detecting haemoglobinopathies in antenatal patients. Indian J Pathol Oncol. 2018; 5(1): 6–11.
- Trent RJ. Diagnosis of the haemoglobinopathies. Clin Biochemist Rev. 2006; 27(1): 27.
- Arishi WA, Al-Hadrami HA, Zourob M. Techniques for the detection of sickle cell disease: A review. Micromachines.2021; 12(5): 519.
- Sarah B, Sheikh K, Shah T. Red cell distribution width is early marker for detection of iron deficiency anemia during pregnancy. J Liaquat University Med Health Sci. 2018; 17(3): 165–169.
- Ramby AL, Goodman DM, Wald EL, Weiss SL. Red blood cell distribution width as a pragmatic marker for outcome in pediatric critical illness. PLoS One. 2015; 10(6): e0129258.
- Nishad AN, De Silva IS, Perera HL, Pathmeswaran A, Kastutiratne KA, Premawardhena AP. Role of red cell distribution width in screening for Hb E trait in population screening for hemoglobin disorders. J Pediatr Hematol Oncol. 2014; 36(8): e490–e492.
- Nahm FS. Nonparametric statistical tests for the continuous data: The basic concept and the practical use. Korean J Anesthesiol. 2016; 69(1): 8.
- Lee H, Kong S-Y, Sohn JY et al. Elevated red blood cell dis-tribution width as a simple prognostic factor in patients with symptomatic multiple myeloma. Biomed. Res. Int. 2014; 2014: 1–8.
- Lochowski M, Cha_lubi´nska-Fendler J, _Lochowska B, et al. Prognostic value of red blood cell distribution width-standard deviation (RDW-SD) in patients operated on due to nonsmall cell lung cancer. J. Thorac. Dis. 2020; 12(3): 773-781.
- Cheng S, Han F, Wang Y, et al. The red distribution width and the platelet distribution width as prognostic predictors in gastric cancer. BMC Gastroenterol. 2017; 17(1): 1–11.
- Qin Y, Wang P, Huang Z, et al. The value of red cell distribution width in patients with ovarian cancer. Medicine (Baltimore). 2017; 96(17): 1–5.
- Yao D, Wang Z, Cai H, Li Y, Li B. Relationship between red cell distribution width and prognosis in patients with breast cancer after operation: a retrospective cohort study. Biosci. Rep. 2019; 39(7): 1–9.
- Ai L, Mu S, Hu Y. Prognostic role of RDW in hematological malignancies: a systematic review and meta-analysis. Cancer Cell Int. 2018; 18: 1–8.
- Li N, Zhou H, Tang Q. Red blood cell distribution width: a novel predictive indicator for cardiovascular and cerebrovascular diseases. Dis. Markers. 2017; 2017: 1–23.
- Jairajpuri ZS, Rana S, Hassan MJ, Nabi F, Jetley S. An analysis of hematological parameters as a diagnostic test for malaria in patients with acute febrile illness: an institutional experience. Oman Med. J. 014; 229(1): 12–17.
- Wei S, Cui H, Zhang S, Zhang A, Zhang Y, Jiang S. Red blood cell distribution width predicts postoperative death of infective endocarditis. Int. Heart J. 2020; 61(3): 524–530.
- Roumeliotis S, Stamou A, Roumeliotis A, Theodoridis M, Leivaditis K, et al. Red blood cell distribution width is associated with deterioration of renal function and cardiovascular morbidity and mortality in patients with diabetic kidney disease. Life. 2020; 10 (301): 1-16.
- Yılmaz ZV, Yılmaz E, K¨uc¸¨uk¨ozkan T. Red blood cell distribution width: a simple parameter in preeclampsia. Pregnancy Hypertens. 2016; 6(4): 285–287.
- Ruopp MD, Perkins NJ, Whitcomb BW, Schisterman EF. Youden Index and optimal cut‐point estimated from observations affected by a lower limit of detection. Biom J. 2008; 50(3): 419–430.
- Mutua BM, Sowayi G, Okoth P. Red cell distribution width as a surrogate marker of haemoglobinopathies in western Kenya. Afr J Lab Med. 2022; 11(1): a1644.
- Roth IL, Lachover B, Koren G, Levin C, Zalman L, Koren A. Detection of β-Thalassemia Carriers by Red Cell Parameters Obtained from Automatic Counters using Mathematical Formulas. Mediterr J Hematol Infect Dis. 2018 Jan 1; 10(1): e2018008.

