Review Article - Volume 2 - Issue 6
Do clinical and demographic characteristics affect pain self-efficacy in chronic disease patients undergoing occupational therapy? A cross- sectional study in Greece
Foteini Terzaki1; Maria Tsironi2; Paraskevi Theofilou1*
1Hellenic Open University, School of Social Sciences, Patra, Greece.
2University of Peloponnese, Department of Nursing, Tripoli, Greece.
Received Date : Nov 4, 2022
Accepted Date : Dec 07, 2022
Published Date: Dec 29, 2022
Copyright:© Paraskevi Theofilou 2022
*Corresponding Author : Paraskevi Theofilou, University of Peloponnese, Department of Nursing, Tripoli, Greece..
Email: pardrothe@gmail.com
DOI: Doi.org/10.55920/2771-019X/1334
Abstract
The purpose of this research is to study the correlation of pain self - efficacy to the time of occupational therapy, gender,age and the years that have passed since the diagnosis. The sample consists of 63 people, all chronic disease patients of the above patients, according to the research design, half receive Occupational Therapy services at a rate of 50.8% (32 patients) while the remaining 49.2% (31 people) did not receive. For the data collection MVQOLI-15 was used. The results indicated that statistically significant differences were found in pain self efficacy, where women comparatively seemed to enjoy higher levels than men (p<0.05). A statistically significant (p=0.016<0.05) monotonic negative correlation (r=0.421) appeared between age and pain self efficacy. It is obvious that demographic characteristics affect pain self - efficacy in chronic disease patients but not clinical characteristics.
Keywords: Occupational Therapy; pain self-efficacy; chronic disease; clinical characteristics; demographic characteristics
Introduction
Pain, according to the classification subcommittee (Subcommittee of Taxonomy) of IASP (International Association for the Study of the Pain), is defined as a unpleasant aesthetic and emotional experience that is associated with already existing or potential tissue damage or which is described as such [1]. Pain measurement can be used to diagnostic purposes, for therapeutic approaches and to assess the effectiveness of a treatment. Answers to questionnaires can reveal its nature, onset, focus and morphology pain, providing important diagnostic data [2,3]. There are many reliable and valid ones available pain assessment methods, which are based on self assessment. The McGill Pain Questionnaire consists of three items main sections, which represent the aesthetic, the emotional and cognitive component of pain, respectively [4]. The Wisconsin Brief Pain Questionnaire is a short multidimensional questionnaire, which has been used extensively in patients who suffer from cancer and arthritis [5].
The Memorial Pain Assessment Card (MPAC) blames pain, relief from it, as well and patient disposition using visual proportional scales combined with word list, from which the patient chooses the ones that describe her intensity of his pain [6]. Psychological assessment can be demonstrated potentially very useful, especially in situations where pain alters the patient’s ability to participate in his daily activities, affects the relationships his relationships with others and causes him disproportionate emotional charge. Also, it can be proven useful in choosing a coping strategy of pain in terms of the psychological field, as well and in the behavioral domain [7]. Her polyphasic personality questionnaire Minnesota (Minnesota Multiphasic Personality Inventory, MMPI) is the most commonly used for the assessment of personality traits in patients suffering from chronic pain [8,9]. Here, it should be noted that the tension is the most subjective from the characteristics of pain. Value- is scored with the help of rating scales. The scales they try to give subjective experience one as objective as possible [10]. Visual analog scales, numerical and verbal scales are included in measurement scales based on the self- ssessment of specific parameters of pain.Many studies have dealt with the pain of chronic disease patients [11-13]. In a study conducted in Switzerland in 2013, 123 patients participated with chronic renal failure who were undergoing hemodialysis (HA). Total of patients reported pain and fatigue as major annoyances, with 66% considering pain as the dominant nuisance. From the findings of the study the association of pain with symptoms emerged, such as shortness of breath, fatigue/weakness, anorexia, nausea/ vomiting, constipation, anxiety, sleep disorders. The most frequent pain reported was musculoskeletal tic (64%) followed by headache (31%) and cramps (20%) which are the main complaints during hemodialysis [11].
In another study, 224 hemodialysis patients completed the Missoula-VITAS Quality of Life Index-15 and the Pain Self-Efficacy Questionnaire. The study was conducted in four dialysis units in hospitals of the Peloponnese region. The more effective the self-efficacy in pain, the lower the quality of life enjoyed by hemodialysis patients. The majority of respondents described the overall quality of life as “moderate,” while the self-efficacy in pain depended on comorbidity or complications that accompany the process of hemodialysis [14]. Silva et al. [15] studied self-efficacy, quality of life, and pain intensity in people with chronic disease. The sample included 95 people with chronic pain. The correlations indicated that individuals with chronic pain and high levels of self-efficacy might present lower pain intensity and better quality of life. The purpose of this research is to study the correlation of the pain self - efficacy to the time of occupational therapy, gender, age and the years that have passed since the diagnosis.
Method
It is a quantitative cross-sectional study including the independent variables (time of occupational therapy, gender, age and the years that have passed since the diagnosis) and the dependent variable of pain self - efficacy. The sample consists of 63 people, all chronic disease patients. Of the above patients, according to the research design, half receive occupational therapy services at a rate of 50.8% (32 patients) while the remaining 49.2% (31 people) did not receive. The inclusion criteria for the sample’s selection were > 18 years old, diagnosed with a chronic disease and speaking the Greek fluently.
For the implementation of this research, the questionnaire was used as a tool due to the many comparative advantages that characterize it (many examinees, low costs, ease of processing and analysis of the results, etc.). In particular, the two individual tools were used: Questionnaire to capture demographic data and questionnaire to capture pain self - efficacy. In more detail, the research tools are described below:
The demographic data of the sample was coded by a series of closed-ended questions, where gender, age, place of residence, occupation, etc. were specifically examined. To measure pain self - efficacy, Pain Self - Efficacy Questionnaire (PSEQ) was used. In its original form, the PSEQ consisted of 10 questions [16] and created in 1980 by Michael Nicholas [17]. Furthermore, it has been used in Portuguese patients [18] with chronic musculoskeletal pain but also in Chinese patients [19] with chronic pain under physical therapy. It can be applied to all clinical situations of the pain. It covers a wide range of functions, including household chores, social fatigue, work, and coping of pain without drugs. It takes two min to be completed [17]. The specific questionnaire also explores valuecalculates the patient’s ability to perform routine tasks activities and to have a smooth individual, family life and social life despite the presence of chronic pain in his individual medical history. It consists of 10 questions, with which effectiveness is examined chronic pain management by the patient himself, even without the administration of analgesic therapy. To construct the corresponding score, sum- the patients’ answers to the 10 questions are shown. THE coding of the responses is as follows: 0=not at all sure, 1=somewhat sure, 2=not so sure, 3=don’t know/don’t answer, 4= enough sure, 5=very sure and 6=absolutely sure. Therefore, the score ranges from 0-60, with a high score indicating greater effectiveness in pain management [19].
For the implementation of the research, the questionnaire was distributed electronically, through the Google forms platform. The researcher got in touch with Occupational Therapists working in rehabilitation centers as well as doctors who follow chronic patients, in order to forward the questionnaires to a sample of patients. The questionnaires were completed electronically and anonymously by the patients or with the help of their companions. As the aim of the research is the comparative study between patients who receive Occupational Therapy services and those who do not, care was taken to obtain a sample of both chronically ill patients who receive Occupational Therapy services and those who do not. Before completing the questionnaire, the patients had to agree to ethical conditions, related to anonymity, confidentiality and the assurance that the results will be used strictly and only in the context of the statistical analysis of the research. The responses, after being coded, were processed with the statistical package spssv19. To capture the descriptive statistics, frequency, relative frequency, mean value and standard deviation were calculated with simultaneous visualization with bar graphs, histograms or histograms as appropriate. To draw inductive conclusions, non-parametric tests were used, such as the Independent Sample’s test statistical test and Pearson correlation.
Results
The sample consists of 63 people, all chronic disease patients. Of the above patients, according to the research design, half receive Occupational Therapy services at a rate of 50.8% (32 patients) while the remaining 49.2% (31 people) did not receive.
Recipients of Occupational Therapy Services
As previously mentioned, there are 32 receiving Occupational Therapy services (50.8% of the total sample).Of these, 29.0% are men (9 people) and 71.0% are women (22people) while we also have a missing value. The average age of those receiv-ing Occupational Therapy Services is 52.56 years (SD: 16.49), while the median age is 56 years. Ages range from 19 to 94 years. In continuation of the above, those receiving Occupational Therapy services have been diagnosed with the disease for an average of 10.31 years (TA: 10.751), while the median number of years that have passed since the diagnosis of the disease is 8.00 years. In addition, the range of years that have passed since the diagnosis of the disease is 59, ranging from 1 to 60.
Finally, and regarding the frequency of receiving Occupational Therapy services, the sample was asked in an open-ended question about the time they receive Occupational Therapy services and the frequency with which they receive them (“If you receive Occupational Therapy Services, how long do you receive them and how often”). To capture the results, the frequency of download was divided into times/week and correspondingly the total duration of download into years. It was found that the average weekly frequency of receiving Occupational Therapy services amounts to 2.34 times/week (SD: 1.54). Accordingly, the minimum weekly frequency of receiving Occupational Therapy services is 0.5 times/week (once every two weeks) while the maximum is 7 times/week (every day).Accordingly, the average years of receiving Occupational Therapy services amounts to 2.23 (SD: 2.37).The years of receiving Occupational Therapy services range from 0.25 years (one quarter) to 10 years.
Non-Recipients of Occupational Therapy Services
Accordingly, and in continuation with the above, there are a total of 31 people not receiving Occupational Therapy services, of which 32.3%(10 people) are men while the remaining 67.7% (21 people) are women. Looking at the age distribution of those not receiving Occupational Therapy services, we can see that the minimum age is 24 years, while the maximum is 78 years. Mean age is 50.65 years (SD: 15.58) while median age is 52 years. Examining the years that have passed since the diagnosis of the disease, for those not receiving Occupational Therapy services, we can find that the average value is 9.97 years (SD: 11.71) and in addition the minimum value is 1 year and the maximum 62.
Pain self-efficacy
As previously mentioned, the Nickolas M.F questionnaire was used to approach pain self-efficacy, which “measures” the self-confidence and confidence felt by people with chronic pain in performing a series of daily and not only activities. It consists of a series of 10 sentences in which the sample expresses the confidence they feel on a 7-point Likert-type scale, calibrated from 0 to 6, while the smallest values (closer to 0) correspond to low self-efficacy in pain, while higher values (close to 6) correspond to high self-efficacy. To approximate total self-efficacy, the individual scores of the 10 questions were summed to form the total sum scale. It is obvious that the range of the scale is expected to be from 0 to 60, where comparatively smaller values (closer to 0) correspond to lower self-efficacy, while higher ones correspond to higher self-efficacy. Values near 30 are expected to correspond with neutral pain self-efficacy.
We can find that the average value of the sample regarding self-efficacy amounts to 39.10 (TA: 13.25), from which we can conclude that the sample appears moderately self-efficacious. Beyond this, the minimum value of self-efficacy amounts to 11,000 while the corresponding maximum to 64,00. The median price is 41.00, while the prevailing price is 50.00. In more detail, the distribution of the self-efficacy values of the sample is shown in the following histogram:
Graph 1: Histogram of Pain Self-Efficacy Values

We therefore found that the sample appears moderately selfefficacious overall. For a better approximation of self-efficacy, we will calculate the average value for each of the statements that make up the self-efficacy scale. It is obvious that values close to 0 correspond to a low occurrence of the measured property, while values close to 6 correspond to a high occurrence of it.
Pain Self-Efficacy by Gender
To examine the difference in pain self-efficacy according to gender, we will first present the descriptive statistics for the two genders and then implement the independent samples t-test. From the examination of the mean value on the said scale, we can find that Women show a comparatively higher pain self-efficacy with the corresponding mean value amounting to 41.74 (SD: 12.20) comparatively higher than the selfefficacy of men for which the mean value of the scale is 33.05 (TA: 14.22). The distribution of the scale values for the two sexes is shown in the following thetogram:

Graph 2: Histogram of Pain Self-Efficacy for both sexes
In order to examine the statistical significance of the difference shown, we will implement the statistical control –t-test of independent samples after having previously formulated the null and alternative research hypothesis: H0: There is no statistically significant difference in mean pain self-efficacy for
Table 1: Differences in Pain Self-Efficacy for both sexes.

First from the results of Levene’s test we can find that with F=0.822, p=0.368>0.05 that the null hypothesis of equality of variances between the two groups cannot be rejected. Next, from the t-test statistical control we can find that with t=- 2.457, df=60. p=0.017<0.05 the null hypothesis is rejected and therefore there is a statistically significant difference in mean pain self-efficacy between the two sexes, with females showing comparatively higher self-efficacy.
Self-efficacy in Pain and its Correlation with Age
Next, we will examine the existence of a correlation between age and pain self-efficacy. First, we will plot the two variables and then calculate the pearson correlation coefficient. The graphic representation of the two variables, together with the palindomic line, is shown in the following graph:

Graph 3: Pain self-efficacy and Age
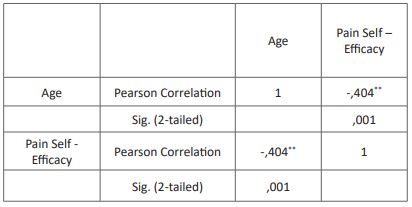
From the graph above, we can see that there is a negative correlation between age and measured pain self- fficacy, in the sense that pain self-efficacy decreases with increasing age. From the calculation of the Pearson correlation coefficient, we can see that with r=-0.404, p=0.001<0.05 there is a statistically significant, negative and moderately strong correlation between the two variables which is also statistically significant. In conclusion, we can find that age is moderately and negatively correlated with pain self-efficacy in the sense that an increase in age is expected to bring about a decrease in pain self-efficacy
Table 2: Pearson correlation coefficient of pain self-efficacy and age.

Pain Self-Efficacy and Its Correlation with Years since Illness
Accordingly and in order to examine pain self-efficacy and its association with years since the disease, we will plot the two variables, which have as in the following graph:

Graph 4: Pain self-efficacy and years since disease diagnosis.
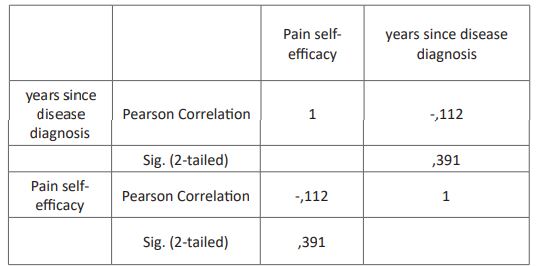
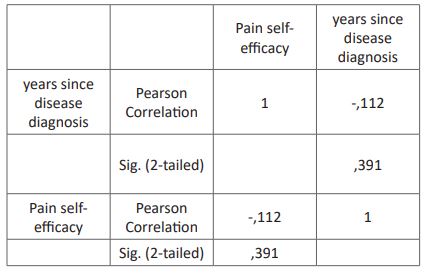
From the above graph we can conclude that no correlation seems to be found between the two variables, while the two variables seem to fall into a negative correlation. Indeed, from the Pearson correlation coefficient with r=-0.112, p=0.391>0.05, no statistically significant linear correlation emerges.
Table 3: Pearson correlation coefficient of pain self-efficacy and years since diagnosis.

Pain Self-Efficacy and Its Correlation with Weekly Frequency of Receiving
Occupational Therapy Services In order to examine the chance association between pain self-efficacy and frequency of receipt of occupational therapy services, we will calculate the Pearson correlation coefficient after first plotting the two variables:

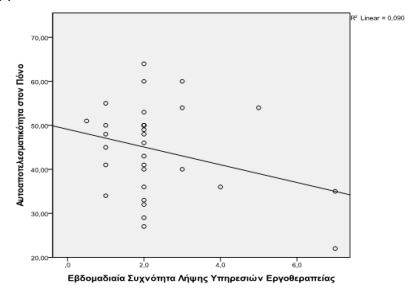
Graph 5: Pain self-efficacy and inpatient frequency of receiving occupational therapy services.
We can see that the two variables do not appear to be linearly related. Indeed, from the calculation of the Pearson correlation coefficient, with r=-0.300, p=0.101>0.05, no statistically significant correlation between them emerges.
Table 4: Pearson correlation coefficient for pain self-efficacy and weekly frequency of receiving occupational therapy services

Discussion
The purpose of this research is to study the correlation of the pain self efficacy to the time of occupational therapy, gender, age and the years that have passed since the diagnosis. From the analysis of the results of those receiving Occupational Therapy services, statistically significant differences were identified in pain self efficacy between the two genders, where women seem to enjoy comparatively higher levels than men. This finding is not in agreement with several studies on chronic diseases, presenting female patients feeling more depressed than males and with lower quality of life [20-23].
In addition, in those receiving Occupational Therapy services, a statistically significant and negative correlation was found between age and pain self efficacy, which means that older people do not present high efficacy to manage pain. This finding is in agreement with other studies indicating that older people present lower level of efficacy [24]. In continuation of the above, no statistically significant correlation is observed between the years that have passed since the diagnosis of the disease and pain self efficacy as well as between the weekly frequency of receiving Occupational Therapy services and pain self efficacy. Last but not least, this study had some limitations due to its small sample. It is noted that the results can be further investigated in larger samples from other groups of chronic disease patients. In future research there may be the possibility of investigating other factors that are related to or affect the levels of quality of life.
References
- International Association for the Study of Pain. Classification of chronic pain. 2nd ed. Seattle, IASP Press. 1994.
- Hagger MS, Orbell S. A meta-analytic review of the commonsense model of illness representations. Phychol Health. 2003; 18: 141-184.
- Turk DC, Monarch ES. Biopsychosocial perspective on chronic pain. New York, Guilford. 2002.
- Melzack R. The McGill Pain Questionnaire: Major properties and scoring methods. Pain. 1975; 1: 277-299.
- Daut RL, Cleeland CS, Flanery RC . Development of the Wisconsin Brief Pain Questionnaire to assess pain in cancer and other diseases. Pain. 1983; 17: 197-210.
- Minasidou E, Lemonidou X. Quality of life of elderly people diseases and the theory of the social production of functions. Nursing. 2005; 44: 202-211.
- au E. Assessment of pain. Greek Society Seminar of Pain Treatment and Palliative Care “Treatment of Pain”, Arta. 2012.
- Ahles TA , Blanchard EB, Ruckdeschel JC. The multidimensional nature of cancer-related pain. Pain. 1983; 17: 277-288.
- McGuire DB. Cancer-related pain: A multidimensional approach. Dissert Abstr Int. 1987; 48: 705.
- International Association for the Study of Pain; Task force on acute pain. Management of acute pain: A practical guide. Seattle, IASP Publications. 1992.
- Gamondi C, Galli N, Schonholzer C, Marone C, Zwahlen H, Gabutti L, et al. Frequency and severity of pain and symptom distress among patients with chronic kidney disease receiving dialysis. Swiss Med Wkly. 2013; 143: w13750.
- Bruera E, MacMillan K, Hanson J, MacDonald RN. The Edmonton staging system for cancer pain: Preliminary report. Pain. 1989; 37: 203-209.
- Davison SN, Jhangri GS. The impact of chronic pain on depression, sleep, and the desire to withdraw from dialysis in hemodialysis patients. J Pain Symptom Manage. 2005; 30: 465-473.
- Zyga S, Alikari V, Sachlas A, Stathoulis J, Aroni A, et al. Management of Pain and Quality of Life in Patients with Chronic Kidney Disease Undergoing Hemodialysis. Pain Manag Nurs.2015; 16(5): 712-20. [PMID: 26162558; DOI: 10.1016/j.pmn.2015.03.004].
- Silva MS, Hortense P, Napoleao AA, Stefane T. Self-efficacy, pain intensity, and quality of life in individuals with chronic pain. Rev. Eletr. Enf. [Internet]. 2016; 18: e1145. Available from: http://dx.doi.org/10.5216/ree.v18.29308.
- Theofilou P, Aroni Α, Tsironi M, Zyga S. Measuring pain self efficacy and health related quality of life among hemodialysis patients in Greece: A cross-sectional study. Health Psychol Res. 2013; 1: 74-78.
- Tonkin L. The Pain Self-Efficacy Questionnaire. Aust J Physiother. 2008; 54: 77.
- Ferreira-Valente MA, Pais-Ribeiro JL, Jensen MP. Psychometric properties of the Portuguese version of the Pain Self-Efficacy Questionnaire. Acta Reumatol Port. 2011; 36: 260-267.
- Vong SK, Cheing GL, Chan CC , Chan F, Leung AS. Measurement structure of the Pain Self-Efficacy Questionnaire in a sample of Chinese patients with chronic pain. Clin Rehabil. 2009; 23: 1034-1043.
- Vazquez I, Valderrabano F, Fort I, Jofre R, Lopez-Gomez JM, et al. [Differences in health-related quality of life between male and female hemodialysis patients]. Nefrologia. 2004; 24(2): 167-178.
- Gottlieb SS, Khatta M, Friedmann E, Einbinder L, Katzen S, Baker B, et al. The influence of age, gender, and race on the prevalence of depression in heart failure patients. J Am Coll Cardiol. 2004; 43(9): 1542-1549.
- Di Marco F, Verga M, Reggente M, Maria Casanova F, Santus P, et al. Anxiety and depression in COPD patients: The roles of gender and disease severity. Respir Med. 2006; 100(10): 1767-1774.
- Oikonomidou G, Zlatanos D, Vayopoulos H, Hatzidimitriou H. Depression in patients with chronic renal failure. Dialysis Living. 2005; 14: 22-32.
- Theofilou P, et al. Reliability of the Greek Version of “Pain Self-Efficacy Questionnaire” in Patients with Chronic Kidney Disease. Hellenic Journal of Nursing. 2014; 53(2): 175-184.

