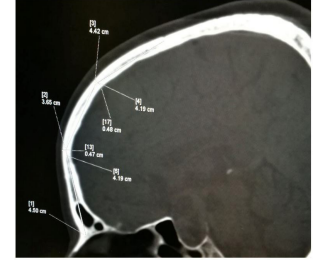
Figure 1: Measuring the thickness of frontal bone in sagittal plane.
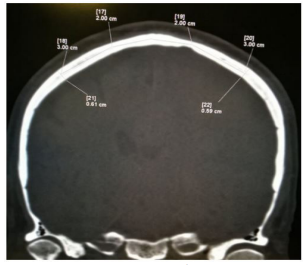
Figure 2: Measuring the thickness of parietal bone in coronal section.
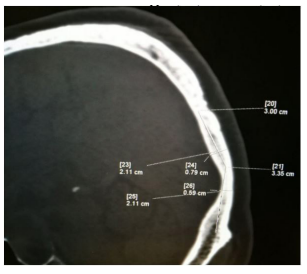
Figure 3: Measuring the thickness of occipital bone in sagittal section.
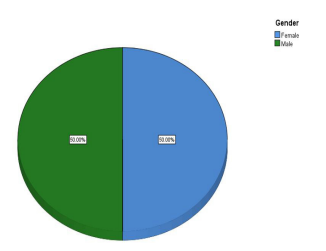
Figure 4: Pie Diagram Showing the Distribution of Total Sample Size According to Sex.
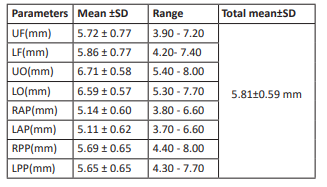
Table 1: Distribution of mean, SD, and Range of the total sample (n = 122).
Data collection tool:
CT scan was performed on 128 slice MDCT scanner (Seimens Somatom Defination As+, TUTH, Biomedical equipment no: 1001915) and data collection and measurement was done in Syngo Via workstation with resolution of 3 megapixel.
Statistical Analysis
Statistical analysis was carried out with the help of SPSS version 26 (IBM, Window OS, Free trial license) and Microsoft Excel version 2010 (32 bit OS). The quantitative value for thickness of UF, LF, UO, LO, RAP, LAP, RPP, and LPP were analyzed using Shapiro Wilk test for normal distribution. Data were presented as mean, range and SD for all variables. Patient’s age, gender, UF, LF, UO, LO, RAP, LAP, RPP, and LPP were recorded. The tested quantitative data was analyzed using independent sample t-test with gender and Karl Pearson’s correlation with age. A 95% confidence interval was taken and p<0.05 was considered to be statistically significant.
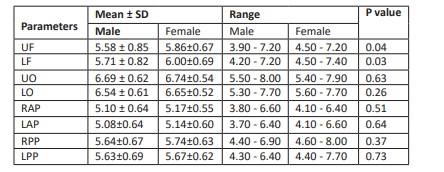
Table 2: Distribution of Mean Value, SD, Range, and P-value in male (n1 = 61) and females (n2 = 61).

